6.2 Case A: Wholesale company
This section describes the action taking part of the action
research: how incremental ME principles were followed in a wholesale company.
The section is organized according to the process of ME (cf. Figure 5-2). First,
we describe the background of the company in Section 6.2.1 and characterize the
ISD environment in Section 6.2.2. These characterizations are applied in method
selection and construction. The results of the
a priori phases are
described in Section 6.2.3 by discussing the metamodel and tool support
implemented. Section 6.2.4 briefly describes the method use. The remaining
sections focus on an
a posteriori view: Section 6.2.5 describes the use
of evaluation mechanisms, and Section 6.2.6 clarifies refinements and lessons
learned from the methods. The research results (i.e. the evaluation part of
action research) are described in Section
6.4.
6.2.1 Background of the study
Case A was carried out in a major Finnish wholesale company.
Its central line of business is to buy goods and to deliver them to customers
through a central warehouse and regional distribution centers. During the study
the company was in the middle of a major business reorganization, in which it
was decided to remove the regional distribution centers: i.e. a move from a
three-level to a two-level organizational structure. The ISD efforts focused on
the company’s order entry and purchasing processes which had multiple
functions, covering both intra- and inter-organizational functions. The main ISD
objective was to re-design the ordering and purchasing processes, and develop
ISs to support the two-level organization.
The case was chosen because it was thought to be complex
enough, and moreover it implemented the idea of business process-driven modeling
that covers both hierarchy-based and market-based business processes. In fact,
the modeling was carried out in four organizations. In addition to the
wholesaler, these were a manufacturer/supplier, a regional distribution center,
and a hardware store. Because most of the regional distribution centers and some
of the hardware stores were also partially owned by the wholesaler the network
can be further characterized as a quasi-market.
The objective of the study was to develop methods which
would help identify opportunities to improve order entry and purchase processes.
In both of these processes IT plays a significant role. The order entry relates
mostly to selling: through quota processing and order receiving to a delivery.
The purchasing includes processes that deal with the company’s own buying
tasks in inbound business operations. In the inter-organizational setting these
processes are connected: the stakeholders of the order entry are the
company’s customers, and in purchasing they are suppliers and
manufacturers. In other words, these functions form a net of interrelated
processes among companies. Because the business modeling study involved four
organizations, the wholesaler’s order entry activities had to be seen in
connection with the hardware stores’ purchasing activities, and so on.
Although these functions were common to all four companies, the business
development effort was carried out by the wholesaler. Accordingly, the method
construction was based on the wholesaler’s requirements and problems.
The ME effort was organized as a separate task inside the
ISD project. The method was constructed by a person from the wholesaler’s
IT department and by the participating researcher. In addition, help from
external consultants was obtained during problem characterizations. The company
had recently hired consultants to carry out a study of the company’s
logistics. The results of the study were used to characterize the ISD
environment and identify problems expected to be addressed with the
method.
6.2.2 Characteristics of the ISD environment
The initial requirements for method support were quite
general. The method should address inter-organizational processes and it should
allow the definition of an architecture for the networked organization.
Moreover, because of the importance of the underlying logistics of delivered
goods, the method should recognize material flows together with information
flows (as proposed by Bititci and Carrie (1990)). These requirements were
revised in more detail based on the characteristics of the object system
environment.
The initial requirements revealed, however, the necessity
of a method engineering approach. First, no contingency framework for method
selection was found that could address the basic characteristics of the problem
context, such as inter-organizational systems. This was found out by a study
reported in Tolvanen and Lyytinen (1994). In fact, the knowledge of developing
and modeling inter-organizational ISs is relatively modest; not enough to
develop a contingency framework (Stegwee and Van Waes 1993,
Vepsäläinen 1988, Clemons and Row 1991, Tolvanen and Lyytinen 1994).
Second, we did not find any business modeling method that would satisfy the
requirements to model inter-organizational processes, and to specify the
network’s information architectures (cf. Teng et al. 1992).
6.2.2.1 ISD experiences and method knowledge
In the wholesale company, experiences of methods included data
modeling and process modeling. These were part of a method called TKN
(Information Processing Advice). The TKN method was mostly used for the
requirements engineering and analysis phases. For example, the data modeling
part of TKN had been used for conceptual modeling and analysis, but not for
schema design. One reason for this was that implementation was outsourced.
The external consultants applied Yourdon’s (1989a)
structured analysis and a supporting CASE tool (System Architect) in their
study. The tool use was considered necessary because of the size of business
models, but the method was not considered suitable. Because the method was
targeted to develop individual ISs it did not address (de-)centralization,
responsibilities among different organizations, or architecture definition. The
CASE tool offered method adaptation possibilities by allowing the addition of
new attributes (property types in our metamodeling terminology) to existing
method types. This support, however, was too limited. No analysis could be made
based on the property types added and they only supported the abstraction part
of the method-tool companionship.
6.2.2.2 Characteristics of the problem context
Because of the lack of contingency frameworks, the criteria
for method construction were sought from the wholesaler’s problems. Thus,
a characterization of the organization and ISD problems formed the main entry
point for method engineering. These characteristics and problems had been
identified during the company’s own strategy process, and through a recent
study that dealt with the company’s logistics. The problems are listed
below. The numbering of the list allows us to identify their influence on the
constructed method. The following problems had been recognized:
1) Inadequate understanding of other
stakeholders’ purchasing processes. Understanding of the external
environment was found to be inadequate for the provision of a good external
service. Moreover, the shared and fragmented knowledge about business processes
(e.g. goals, resources) within the industry made it difficult for the wholesaler
to streamline its boundary operations towards a more cooperative environment.
For example, in the industry and even in the company’s local outlets
different rules were applied in purchasing and delivery, including non-uniform
product and code standards.
2) Duplicate tasks and routines. One of the most
obvious problems was the duplication of effort. Each company had its own
ordering and purchasing functions and associated supporting systems in which the
data was entered. Moreover, the data in the IS is primarily used to serve each
organization’s own needs. From the network point of view this has led to
sub-optimal solutions and to unnecessary complexity in workflow. The wholesale
company had already taken some steps towards external systems integration (e.g.
data entered once served multiple functions and even multiple organizations),
but data integration was still seen a problem. Duplicate tasks in the network
increased costs, created errors, and lead to longer turn-arounds.
3) Customer satisfaction (i.e. service level) was
problematic. Satisfaction had been measured to be quite high from the
wholesaler’s point of view, but it was considered low on the
customer’s side. The reason for opposing opinions was not due to different
service objectives, but rather due to the way how purchasing and delivery
information was shared. Because customers’ opinions were not based on
statistics, it was expected that better sharing of order and delivery
information could improve the service level.
4) Lack of coordination. Incompatible systems
duplicated data entry efforts and decreased information availability (i.e. data
sharing, access rights). The latter was seen to form a major problem in
developing shared business processes and supporting ISs. These ISs can share and
transmit order and purchasing related information, such as inventory status,
orders, quotations, up-to-date price lists, product descriptions, invoices and
electronic money transfers. The sharing of information, however, needs to be
planned. A concrete example of this was faced in inventory systems where
suppliers or buyers had to check another company’s product information.
5) Unsatisfactory turnaround times. Because of the
fragmented logistic functions the turnaround times were not satisfactory. This
increased inventory costs. Normally, companies knew their own inventory levels
but could not check whether any other store or regional wholesaler
“downstream” had a sufficient stock of a given product. Furthermore,
this poor availability of delivery information tied with a complex ordering
process increased throughput times. Thus, process integration between companies
along the value chain was necessary to speed up cycle times and reduce inventory
levels.
6)
Lack of demand information. Because the
wholesaler’s purchasing system was heavily dependent on marketing
information, and on estimated sales, up-to-date market information played a
significant role. However, the company did not utilize the marketing information
well enough. Moreover, the availability of market information was assumed to be
of interest to other participants in the industry (i.e. suppliers, importers,
and manufactures).
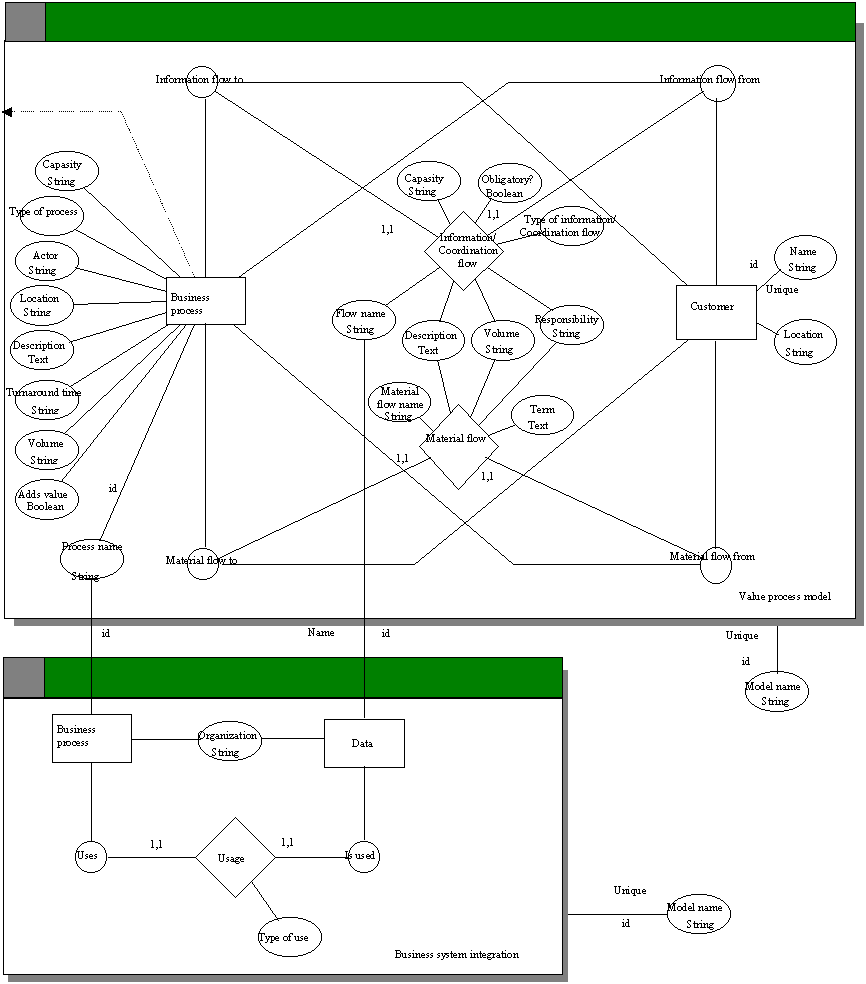
6.2.3 Business modeling method constructed
Here we shall introduce the modeling techniques using a
metamodel and discuss their tool support. We describe how methods were selected
and modified to fit the characteristics of the problem context.
6.2.3.1 Metamodels
Two well-known methods formed a starting point for the method
construction, namely value chain and value systems (Porter 1985, Macdonald
1991), and Business Systems Planning (IBM 1984).
The method construction was guided by the ISD
characteristics and problems. During the construction step we applied
metamodeling to specify the methods and their interrelations. Figure 6-2
contains a metamodel of the selected parts of the methods and their
interactions. The model is based on the GOPRR metamodeling technique discussed
in Section 3.3.3.7 and in the appendix.
The first part of the business modeling effort was to
describe interrelated business processes and their relations. This part we call
value process modeling, after Macdonald (1991). The value process models
describe value adding processes and their dependencies while providing products
and services to the “final” consumer. Although the traditional value
chain (Porter 1985) concentrates on the value adding capability via different
types of processes (i.e. inbound, operation, outbound, etc.) we extended it to
include delivery-related properties, such as ‘location’,
‘capacity’, ‘volume’ and ‘turnaround time’.
These properties we defined as optional whereas ‘type of process’
and ‘process name’ were considered mandatory. The mandatory
constraint, however, could not be modeled into the metamodel and was therefore
not actively checked. The checking of mandatory constraints was enabled by the
analysis reports implemented (i.e. passive checking).
Although in a value chain most information and material
moves downstream, we also wanted to model the opposite because it allows us to
analyze problems related to rework. In other words, duplication of work (cf.
problem 2) often occurs as a result of failures or defects in providing services
(Harrington 1991), causing a return “upstream” in the chain. This is
specified in the metamodel by allowing customers and business processes to send
(participate in “flow from” role types) information and
material.
Each process was further described by an actor to
illustrate process responsibility. In cases where the necessary information was
not available a process could be decomposed. According to the metamodeling
constructs this structure was defined as a dependent, non-mandatory and
exclusive complex object. The metamodeling language, however, did not support
these more detailed characteristics of complex objects (see also Section 4.5).
It allowed, however, aggregating different levels of value process models and
business processes. In the GOPRR metamodel this is described with a
decomposition link (a dotted line with an arrow-head).
FIGURE 6-2 A metamodel of the a priori constructed
method.
The process models concentrated on material flows and on
process information. In this way, it was possible to identify information
requirements for processes that control material handling (cf. Bititci and
Carrie 1990). Both flow types were characterized by their name, description,
mean volume, and responsibility. Material flows were further defined by possible
terms of delivery. Information flows were specified according to their type
(i.e. order, payment, report or control), maximum capacity, and status
(obligatory, optional). Accordingly, the aim of the value process modeling was
to establish a common description of a network of ordering and purchasing
processes (problem 1), identify duplicate tasks (problem 2), and help to focus
on areas which could considerably improve customer satisfaction and cycle times
(problems 3 and 5).
The level of IS integration among the companies was
modeled using a business system integration method, which was a modified version
of BSP (IBM 1984). The use of the original techniques included in BSP (see Table
4-1) was limited to modeling data use in business processes using CRUD (create,
read, use and delete) matrices in architecture planning. The modeling techniques
were integrated through polymorphism: the names of business processes should be
the same in value process models and integration models. Similarly, data
described in architecture models was expected to be specified in value process
models. In other words, the system architecture should not have data classes
which were not specified as instances of flow types in the value process models.
The method also supported modeling of market based IS
integration solutions instead of focusing on integrating processes inside a
hierarchical regime. This was achieved by dividing data handling processes among
different organizations (a property type ‘organization’ in the
metamodel, see Figure 6-2). Each business process was characterized with the
organizational unit it belonged to, and thus organizational dependencies were
represented. In BSP this is achieved by inspecting organizational units against
business processes. Thus, unlike BSP the integration method described IS
architectures where each company had both local and inter-organizationally
shared business processes and data. Moreover, it defined the
inter-organizational responsibilities, data sharing and data availability (e.g.
create, use). The objectives of the integration method were to address and solve
problems related to inter-organizational IS architectures, to improve
coordination through shared data (problem 4), eliminate duplicate data and
processes (problem 2), and to improve availability of market information
(problem 6).
6.2.3.2 Tool adaptation
Both modeling techniques were supported by a computer-aided
tool. The value process modeling was supported by a metaCASE tool, and the
business system integration was supported by a spreadsheet tool.
The metamodel of the value process model was implemented
in a metaCASE tool called MetaEdit (MetaCase 1994). The notation of the value
process model is represented in Figure 6-3, in which a high level view of the
wholesale process is described. With respect to the other parts of the
method-tool companionship, checking and documentation reports were implemented.
The checking reports operated on those aspects of method knowledge which needed
to be checked passively, or were not possible to capture in the metamodel. The
checking reports included unconnected object types (i.e. minimum multiplicity
one) and undefined properties (i.e. mandatory property types). The multiplicity
of types was not inspected because only two object types and relationship types
were used. The documentation reports included dictionary reports and flow
reports. The dictionary report describes property definitions for all instances
of the ‘business process’ and the ‘customer’ object
types. The flow reports describe use of information or material from the
business processes side (i.e. flows in, flows out) and from the flow side (i.e.
which business processes use a specific information flow). The reports on
information flows were used to build the architecture models into a spreadsheet.
The value process model captured most of the design data required for
architecture definition, except the type of usage and the organization. The
organization information could also be detected from the model hierarchy,
although it was not included as separate property type in the metamodel. The
flow reports also served as a basis for documentation and to deliver models for
validation and further inspection.
Because of the use of a non-metamodel driven tool for
business system integration, metamodel based method knowledge could not be
applied. The reason for this was the lack of matrix representation support in
the metaCASE tools reviewed (cf. Bidgood and Jelley 1991). The matrix
representation was considered a necessity because it allowed the analysis of
large architecture models among four organization types in a condensed form and
the representation of couplings between processes and data. Matrices also
provided an abstraction required to develop alternative architectures based on
information availability.
6.2.4 Method use
The ISD project took over half a year, and seven persons from
all four organizations were involved. Most effort was needed to develop the
wholesaler’s downstream activities. The participation of a supplier
organization was limited because they were only interviewed to obtain their
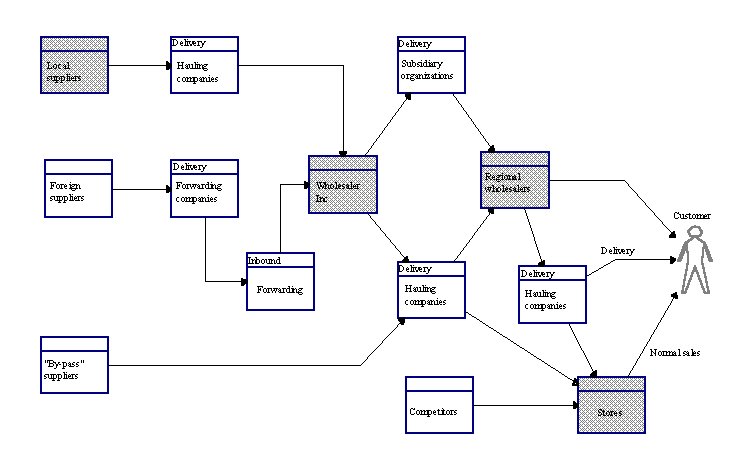
requirements. The value chain of the wholesale process is described in Figure
6-3.
The figure is based on the value process model. The model
describes major parties and business processes. Organizations participating in
the ISD are illustrated through grayed business processes. The value process
model describes only material-based relationships (represented as thick lines
with an arrow head). During the ISD project, delivery, ordering, and purchasing
related controlling information flows were described. In addition, each
participating organization was modeled in more detail by decomposing business
processes.
FIGURE 6-3 Value chain of the wholesaling industry
(modified and partial).
The order entry and purchasing system was decomposed into
around 60 business processes, 140 different information flows, and 30 material
flows. The main outcome of the project was three solutions for managing
purchasing and ordering related processes. These alternative approaches were
differentiated based on the responsibility given to different actors. All these
alternatives required a new IS for sharing ordering/purchasing related
information. A “pull” solution configures the chain based on the
market needs as recognized by the stores: all ordering functions and related
purchasing functions of the wholesaler are based on sales. A “push”
solution means the opposite. It offers control mechanisms for the wholesaler to
monitor sales from the field. This provides better prediction for the
wholesaler’s purchasing functions, and offers possibilities to balance
inventories. A hybrid solution means a combination of these based on the type of
goods: for example, sales of low volume products are difficult to predict
requiring a market-based strategy (i.e. the pull alternative), whereas seasonal
products could be planned by the wholesaler (i.e. the push
alternative).
The alternative solutions and their influence on problem
solving are described in the next section since they were applied in evaluating
modeling power and problem solving
capabilities.
6.2.5 The a posteriori method engineering
In this section we explain how the method was refined during
the case based on the experiences from method use. We first apply type-instance
matching. This part of the study was conducted by the researcher/method engineer
alone. Second, we assess the applicability of the method in terms of how well it
supported business modeling. Third, we try to identify the role of the method in
ISD. These latter two evaluations were conducted by interviewing the
stakeholders based on the method evaluation and refinement mechanisms described
in Section 5. The stakeholders involved were from the wholesale company and
mostly from its IS department. Hence, because the problem characterization and
method construction was accomplished by the wholesaler, the method refinement
was accordingly conducted from the wholesaler’s point of view.
6.2.5.1 Type-instance matching
Type-instance matching deals with inspecting how the
constructed method has been applied. The comparison is made between the
method’s intended use (as seen from the metamodels) and actual use (as
seen from the models). In the following we describe only the results of this
evaluation, i.e. those differences between models and metamodels which suggested
method refinements (cf. Section 5.3.3 for details). Therefore, those questions
or evaluation alternatives which did not reveal any differences are excluded.
Similarly, it must be noted that not all constraint-related evaluations will be
inspected, because the metamodeling language could not capture them.
6.2.5.1.1 Usage of types
1) Unused types. All non-property types were used but
several property types had few, if any, instances. None of the unused property
types were redundant with other property types, but they were not used because
design information could not be found, or was not considered cost-effective to
find. The ‘turnaround time’, ‘capacity’ and
‘volume’ were defined for only 5% of instances of the
‘business process’. The business processes which included these
property definitions operated at a detailed level, or at the organizational
boundaries. The ‘actor’ was defined in 20% of the business processes
because this was considered redundant while decomposing processes. In other
words, actors of lower level business processes were the same, or specific
groups of those in the higher level business process.
As a result, the property types could be removed from the
value process model. Although some other property types had few instances they
were not removed. The ‘volume’ and the ‘responsibility’
was defined in only 5% of the material flows, but for almost each information
flow. Because no special reason for treating the flow types differently was
found (other than the primary focus on information flows during the project) no
modifications were made to these property types.
2) Dividing or subtyping of types was considered
necessary in two cases. First, processes had differences in their naming. Some
high-level processes were named according to organizational units (e.g.
inventory) whereas other were tasks of employees. For the latter cases, the
‘turnaround’, ‘capacity, and ‘volume’ property
types were applied. This suggested that processes must be divided into higher
level business processes and into employee tasks. Second, because of the
inter-organizational setting, several information flows with the same name
referring to different flows were modeled. For example, an order had a different
meaning and content in different companies. This could be detected from models
which had organization-related descriptions related to flows. For example,
“confirmations of an order are delivered directly to shopkeepers”.
Although this was acceptable while modeling information flows of individual
companies, it was not desirable for making an information architecture for the
whole network. Therefore, the flows/data should be specified in terms of the
organization and its content.
3) Definition of new linkages between property
types was suggested in only one situation. Actors and responsibilities of flows
shared the same values. Also, the direction for sharing property values was
found, because all actors were also specified in flows. This aspects is analyzed
in more detail later.
6.2.5.1.2 Usage of constraints
Analysis of constraints is limited to those defined in the
metamodel and supported by the tools. Some of the constraints which could not be
captured into the metamodel, however, could be supported by the tool. These
constraints include the unique property, the mandatory property, and the
multiplicity constraints. For example, a tool could warn about property types
which are not defined, although such a mandatory constraint was not defined in
the metamodel.
Active checking of the mandatory property constraint was
considered important because all classifications of property types were not
specified. As a result, separate architecture models could not be created
automatically for the current ordering system (i.e. by selecting all
order-related information flows from the value process model). The ‘type
of information flow’ property type included also values other than those
which were predefined. The most used was delivery related information. It was
considered relevant for logistics modeling and had to be added to the predefined
values to speed up the modeling work. This addition was also considered
important for analyzing management of delivery information.
Several business processes had flows with the same name,
suggesting the need for n-ary relationships (a role’s minimum cardinality
greater than one). Although this indicated duplicate modeling effort in
situations where design data is updated, the use of n-ary relationships was
considered unnecessary. Moreover, binary relationships could be used for the
same purpose. Our metamodeling constructs did not even have a constraint which
would necessitate the creation of n-ary relationship if two binary relationships
with the same instance information existed.
Multiplicity constraints over two role types could not be
supported but the model indicated that this should be the case for all object
types in both techniques. In other words, existence of an instance of either of
the role types suggested that the role types should be defined as mandatory
(i.e. minimum multiplicity one). Moreover, a typical recommendation in
architecture design, that only one process should create data (i.e. be
responsible for it), was present in the models. Modeling the present state
suggested, however, that it should be possible to model more than one data
creating process.
The specification of complex objects had to be changed:
dependency and non-mandatory rules were applied while decomposing business
processes, but an exclusive component constraint was not. One reason for this
was the need to combine detailed process models and the development of different
versions for representing alternative solutions. Instead of hierarchical
leveling with exclusive components (similar to decomposition in data flow
diagrams) the value process models were unified at lower levels showing detailed
workflows between companies. This required shared business processes in complex
objects. Second, the analysis of scope for the constraint suggests a change from
the method to the model. Otherwise different versions using the same process
could not be made: a tool would necessitate aggregated relationships for all
instances of the process regardless of the model where it is defined (i.e.
decomposed or combined process models). This would result in a model which
included all relationships (and a whole model hierarchy) instead of specifying
those necessary only for the current version.
Analysis of values among different types revealed one new
candidate for a polymorphism structure between the ‘actor’ and the
‘responsibility’. Here the same value could be used although they
are semantically different. The actor means the acting part in the business
process whereas the responsibility is used to define the instance responsible
for delivering the data.
6.2.5.2 Modeling capabilities
The tool supported modeling with abstraction and checking
capabilities. Before evaluating these we describe how the method was used in
modeling the object system. These characteristics are the same ones which drove
the method construction. First the way of modeling is described and then
abstraction and checking capabilities are evaluated.
1) Inadequate knowledge of stakeholders’
processes. Because of the inter-organizational nature of the object system,
the wholesaler’s knowledge of partners’ processes was modest. In
general, only processes that related to costs or interactions at the
organization’s boundary were documented. In synthesizing this fragmented
knowledge the value process model proved to be useful. Its main impact was that
it helped to describe all business processes related to order entry and
purchasing, which were shared processes in all companies. As is typical in
logistics, the specification of material flows between multiple participants and
their mappings to controlling information flows were considered useful. In
particular, process dependencies and responsibilities were revealed which helped
participants see information handling policies.
The main difficulties in abstraction related to
characterizing processes with logistic information. These were already
recognized as unused types (i.e. unspecified turnaround times, capacity and
volumes related to processes). In most cases the business process information
was not found, and if such was specified, it was related to processes at
organizational boundaries, or to an individual’s tasks. Moreover, the
value process model operated at too general a level. This demanded modeling of a
detailed workflow. Process modeling was found redundant in maintaining process
related information between different levels of the process hierarchy. For
example, a turnaround time of a business process should not be smaller than the
sum of those specified to its subprocesses. The manual maintenance of the
property values was one reason why such data was not specified. This required
derived data types or checking reports which could calculate business process
related characteristics from the properties of its subprocesses.
2) Duplicate tasks and routines. In networked
processes, effort duplications occurred at the department and especially at the
company level. In the study, system integration models were used to describe
network-wide processes that use or create similar local data. Examples of such
processes were order entry and delivery notification. The value process showed
the structure of tasks, but not how the processes are carried out: In
particular, the analysis of the current situation required descriptions of more
detailed tasks structures and decisions. For example, the value process model
did not describe alternative possibilities to make orders depending on the
current availability of goods. This suggested a concept of a decision in
relation to the task structures.
Because modeling tools were separate, maintaining
consistency between models created duplicate work. Each change needed to be
updated to other types of models and the information flow report from value
process models to integration models was only used once when the whole network
was transformed into a spreadsheet.
3) Customer satisfaction on delivery did not
involve any other modeling concept or constraint than the involvement of
customers (i.e. stores). The modeling support therefore dealt with specifying
delivery related information flows together with the customers of the
wholesaler.
4) Lack of coordination. The possibilities for
inter-organizational business integration were estimated by deriving IS
architecture models for each company and then later integrating them into a
network wide model. During modeling, difficulties arose because of homonym and
synonym problems in the data, and because the same data class could contain
different information. In order to specify IS architectures in more detail
— e.g. differences in data classes among companies (e.g. in orders or
inventory data) — data modeling was regarded as important: the currently
used techniques were considered inadequate to examine these differences.
5) Unsatisfactory throughput times. One objective
for modeling was to gather data on logistic measures (i.e. capacity, turnaround
times, and delivery conditions) to help find efficient solutions. In practice,
however, we faced several obstacles in accomplishing this task: the smaller
companies did not have the required information on their logistic measures, or
it was not in the required format. Although all companies knew in detail their
material handling processes which operated at the organization’s boundary,
information about internal processes and about non-cost items was seldom
available. Because logistic measures give a detailed picture of the efficiency
of the organization this information was at times kept secret. Moreover, the
modeling revealed the need for different modeling constructs at different
modeling granularities (i.e. detailed tasks are specified differently from
general business processes).
6) Lack of marketing data. The availability of
marketing data was modeled like any other information flow. The value process
models were used to identify the wholesaler’s and stakeholders’
information requirements, and the integration model was used to inspect data
coordination aspects. As with modeling shared data, the models had to be
supported by tools for data modeling (e.g. ERD).
6.2.5.3 Problem solving capabilities
In incremental ME, evaluation is carried out by comparing
modeling outcomes and method principles used to achieve these outcomes. We
inspected this using form conversion and review mechanisms. Form conversion
means the capability of a tool to analyze models and generate candidate designs.
Review mechanisms mean production of documents for stakeholder needs and
validation.
In the following this evaluation is described. First we
describe the project outcome and then the role of the method is
discussed.
1) Knowledge about stakeholder processes was
improved by using the value process models. These helped participants correct or
verify their assumptions of process dependencies and find information that
originated outside their organization. Thus, the value process models mostly
supported the validation and uniform documentation of processes among companies.
In the form conversion part, the process and information flows were also
converted to tentative design data in the business integration model. As a
result, all use-based connections between processes and data could be
automatically converted into the CRUD matrix. Other types of usage could not be
converted, because no indication could be given in flows as to whether a
business process for example had created or only updated the data.
2) Duplicate tasks and routines. The business
integration method allowed the identification of redundant information handling
processes and generation of alternative candidate designs. This is similar to
BSP (IBM 1984) with the distinction that data availability in our case is based
on different organizations. Hence, solutions were sought by inspecting outcomes
of different data integration and sharing possibilities between companies. These
alternatives included, for example, that the wholesaler’s inventory
information is available in real-time for the stores during purchasing, or that
manufacturers can have access to the wholesaler’s inventory and sales
information. As a result, duplicate tasks, both in the order entry and
purchasing activities, were removed through improved information sharing between
companies. These changes also simplified processes by reducing their complexity,
especially in tasks related to handling special kinds of orders, order
confirmations, and out of stock reports. The spreadsheet tool did not automate
solution generation, although this could have been defined based on the
metamodel.
3) Customer satisfaction. As a result of the
modeling effort, customer satisfaction was improved by offering more accurate
information through an on-line ordering system about products, the
customer’s order base and delivery status. These changes were obtained by
first modeling purchasing processes and then customers’ information
requirements. The proposed solutions decreased customers’ uncertainty,
improved the wholesaler’s responsiveness, and moved redundant tasks (such
as recording follow-up of orders, and re-ordering, and related decision making)
from the wholesaler to stores. These changes were also presumed to bind
customers more to the wholesaler. Although none of the metamodel constructs were
directly used to analyze or improve customer satisfaction, the recognition of
delivery information in the instance models allowed the recognition of
availability of delivery information.
4) Lack of coordination. One of the project
outcomes was the overall IS architecture. The method allowed the construction of
several candidate designs, including both “hierarchy based” and
“market based” data integration. By hierarchy based integration we
mean local and company related information modeling, and by market based
integration we mean the integration of data across multiple companies. As an
example of a candidate design based on a market driven approach, we proposed
order entry and purchasing systems which focus on supporting stores and
distribution centers by employing the wholesaler’s or even the
manufacturer’s inventory and delivery information (i.e. the pull
solution). A totally opposite approach would have offered improved control
mechanisms for the wholesaler (i.e. the push solution). For example, by
gathering sales and inventory information from the field, the wholesalers could
unify processes downstream in the chain, e.g. to control product mixes, or
provide information for marketing and inventory control for stores. By these
changes the wholesaler could achieve economies of scale and further improve its
own purchasing processes. In line with the wholesaler’s business strategy,
the selected data coordination mechanisms tightened the relatively free
mechanisms towards a more uniform and cooperative one. Because of the
flexibility of demand, the suggested solutions still allowed a pull solution for
selected products and customers. At the same time it also offered a more
controlled service to other customers or goods which are easy to handle and
predict (such as goods which have a stable demand, a cycle in patterns, or can
be delivered quickly). Because of the lack of full CASE functionality, this part
was not supported by automatic conversion mechanism provided by matrix based
tools (e.g. Kelly 1994). However, conversion reports provided design information
to manually build integration models.
5) Unsatisfactory throughput times. One objective
for ISD was to gather data on logistic measures that help find efficient
solutions. The value process models did not offer enough information about task
structures or logistic measures. Because of unavailable data, such analyses
could not be made with the tool, although the analysis functionality
(flow-in/flow-out reports) was implemented. Hence, the method failed to offer
immediate solutions that could improve cycle times or decrease inventories.
6)
Lack of marketing data. Solutions for
information gathering included an application for summarizing order and sales
data to support the wholesaler’s purchasing processes. This data also
attracted interest outside the company, especially among the manufacturers. One
feasible solution for this problem was an on-line communication system, which
would allow the wholesaler to make queries downstream, e.g. about campaign
products sold, or information about marketing progress and delivery schedules.
In solving this problem, both methods were applied. The value process models
were used to identify the wholesaler’s and stakeholders’ information
requirements and the integration model was used to inspect coordination aspects.
6.2.6 Method experiences and refinements
The outcomes of the method evaluation were two-fold. First, it
offered possibilities to refine the used method, and second it supplemented
existing knowledge about methods and method contingencies. In our case, method
development focused mainly on addressing the networked material flow.
Accordingly, we shall concentrate in the following on the contingencies related
to the organization’s logistic ISs. Experiences from value process
modeling confirmed earlier observations (cf. Österle et al. 1990, Macdonald
1991) of its applicability in process integration. Especially in cases of
multiple companies (e.g. with customers and suppliers), the method helped
clarify both information and material based process dependencies. Moreover, the
method was found to be applicable for network-oriented modeling where the
knowledge of the business is dispersed. At the same time, the method presumes a
strong commitment from participants, especially in cases where the same modeling
accuracy and detail is required.
Problems in data gathering revealed, however, that the
method is not suitable in cases where the processes are not documented, or where
they are constantly changing. Furthermore, the value-oriented approach seemed to
be appropriate only in modeling higher level views. Therefore, in situations
where a more detailed representation was required, and we lacked general process
measures, other methods were needed. The task of business system integration was
likewise hindered by the lack of information. This was especially the case in
dealing with inter-organizational relationships, where each company had a
similar kind of data (such as an order), while its actual content differed
greatly. Thus, although most methods for IS architecture definition do not
strive to develop detailed data models (Österle et al. 1990), our modeling
case clearly demanded the use of such methods. Like most methods for
architecture definition (e.g. Business Systems Planning), the business
integration method is suitable for organizations which are centralized (Sullivan
1985), and where some architecture and system specifications already
exist.
A second outcome of the incremental ME was method
refinements based on method use. The suggested method refinements are defined by
changing the method specifications. It must be noticed that none of the required
changes to the method could be predicted earlier. As the method assessment
clarified, the necessary changes to the method related to modeling task
structures and data. In the case of value process modeling, specifying detailed
task structures required more detailed constructs (as in problem 2 for
specifying more detail tasks, or in problem 5 for finding unsatisfactory
throughput times): Value process models are not rich enough in dealing with a
fine granularity of modeling where we want to describe a team’s or an
individual’s task structures. Some of the necessary data (such as cycle
times in problem 5) could be derived only through modeling system dynamics (cf.
Jordan and Evans 1992). For these reasons, we examined techniques suitable for
modeling business and task dynamics (e.g. Dur 1992). Detailed models of tasks
could be utilized in representing dynamic features of logistic processes.
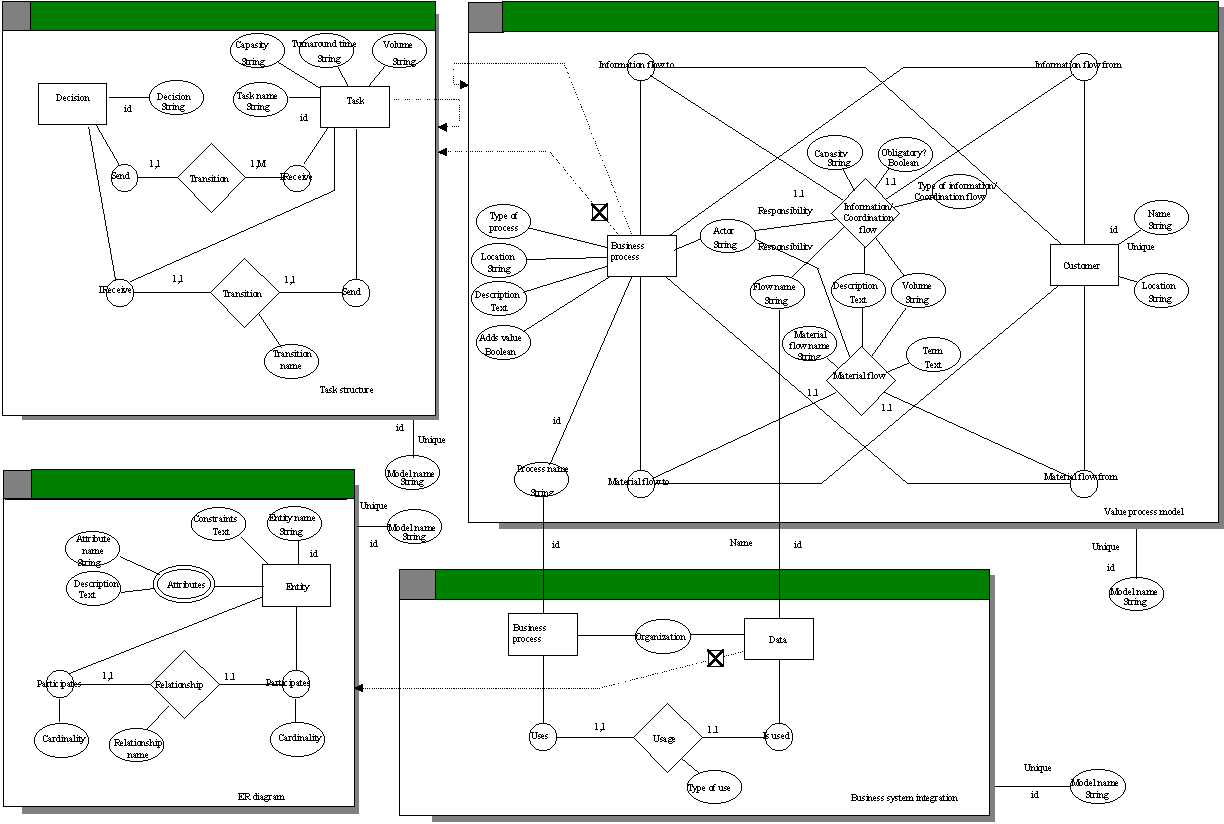
The modeling technique to be used for describing task
dynamics and its connections to the value process model is shown in Figure 6-4.
In the new metamodel each business process can be further specified either by a
new value process model, or by a task structure. In a task structure, a
‘task’ depicts actors and their jobs, a ‘transition’
specifies an order between tasks, and a ‘decision’ possible
alternatives and choice logic. The ‘task’ is further characterized
with properties which originally were related to the ‘business
process’. Hence, task modeling can support information gathering about the
capacity, volume and turnaround times which were found difficult to specify at
higher levels. The use of task structures could be further specified to enable
analysis features. These could include data about actors’ workload, delay
and priority of tasks, transitions, and other behavior to handle alternative
conditions in transitions. These analyses were not made because the aim of the
study was not to tune individuals’ tasks structures, but rather to design
the overall architecture of the ISs.
In carrying out system integration the requirements for a
more detailed data analysis could be satisfied by connecting an
entity-relationship diagram (ERD) to the business system integration method (see
Figure 6-4). This refinement related mostly to making higher level abstractions
and improving the analysis of common/shared data, i.e. problem 4. Here data
classes identified in the business system integration models were defined in
terms of ERDs. This was expected to allow the specification of different views
of the same data and inspect differences in local data, e.g. in ordering, where
information requirements are often different. Another example can be found in
purchasing, where the wholesaler’s information requirements are totally
different from those of regional wholesalers and stores, and where the terms of
delivery and prices are permanent. The conceptual structure of an ER diagram
followed the TKN method already used in the wholesaler’s IT department,
and was similar to the metamodel developed in Section 4.3.2.
In addition to these new modeling techniques the existing
ones were modified. The type-instance matching added new predefined values for
property types, such as delivery information to the classification of
information flows. Similarly, a polymorphism structure was defined between the
‘actor’ and the ‘responsibility’. This modification
speeded up modeling and improved consistency: it allowed to reflect changes in
one actor value to all other flows or business processes which referred to the
same value.
FIGURE 6-4 Method after refinements.
The method evaluation also suggests changes which could
not be captured into the metamodel or supported by the modeling tool. Because of
the limited metamodeling power of OPRR (see Section 4.5), the metamodel could
not adequately specify identifiers, uniqueness and mandatory properties. Other
constraints which were needed and not supported related to multiplicity of
roles, complex objects, and polymorphism. This means that the tool could not
check actively that the method knowledge was followed. These constraints can,
however, be supported passively through reports.
In addition to the metamodeling constraints applied for
evaluation, the case reveals a need for a derived data type. By a derived data
type we mean a property type whose instance value can be calculated from other
instances values. For example, turnaround times needed to be calculated from
lower level task structures. Similarly, derivation of these values can be
performed with reports. For example, if actor names are not given they could be
derived from the aggregate business process.
Consistency checking problems suggest the use of a single
modeling tool which supports different representation forms. This modification,
however, is related more to the required features of the modeling tool than to
the method, and therefore is not considered further here.