Demo 7 / 27.10
The topic of the current demonstration is two-dimensional arrays and the center of the set of points. In this example picture
theMiddleNumbersOfSetOfPoints.png we have on a level a set of points out of a hat. We have calculated the center of mass of the set of points (red circle), the mide of the set of points (green circle) and the mide calculated of each coordinate (blue circle). You can carry out the tasks in a same class if the tasks relate to each other. In case you want to do separate files (classes) so that you have different files for drawing and calculations you can call the method (subprogram in class
Calculations.java for example)
mide from another file as follows:
double ym = Calculations.mide(dots[1]);
An another way is to put static import in the beginning of the file:
import static demo7.Calculations.mide;
...
double ym = mide(dots[1]);
Mide is the dot nearest to the average.
Tasks
1.
Ville: Run Ville web application (look:
https://trac.cc.jyu.fi/projects/ohj1/wiki/villeEn) and carry out task rounds: Strings, Loop structures and Methods. The tasks are in Finnish but feel free to try them. By finishing them you'll get points. Scale the amount of tasks done to the range [1,0] and round the point you get with precision of 0.2. (An example: if you did 120/195 tasks (=0.615) mark 0.6 as you final point. If 140/195 (=0.72) mark 0.8.)
2.
Two dimensional arrays: Represent dots (number pairs as xy-coordinates) in a two-dimensional array so that in the first line (index 0) is situated all the values for x-coordinates and in the second line (index 1) all the values for y-coordinates. Thus the coordinates for the dot
i would be:
x = dots[0][i];
y = dots[1][i];
This is not necessarily the best possible way of representing number pairs, but it is usable during now. Problem is that every line of an array like this doesn't have to be equally long. Nevertheless, download the NumbersGraph.java and create subprograms needed in order to make the program to draw a picture similar to the black circles in the
theMiddleNumbersOfSetOfPoints.png:
public static void main(String[] args) {
int dotAmount = 100;
double min = 0;
double max = 10;
double r = (max-min)/100;
double dots[][] = new double[2][];
dots[0] = randomNumbers(dotAmount, min, max);
dots[1] = randomNumbers(dotAmount, min, max);
Window window = new Window(600,400);
window.scale(min-1,min-1,max+1,max+1);
window.add(new Axis(100,100,0));
drawPicture(window,dots,r);
window.showWindow();
}
Hint: In demo 6 we made the most of the subprograms needed:
Keskiluku.java. (An example answer in Finnish).
3.
Find the closest: Write a function subprogram
placeOfClosest(dots,x,y) that searches for the closest dot to the dot
(x,y) in the table
dots and returns its index. You can test this with for example this:
  double[][] numbers = {
    {1,2,1,4 },
    {1,1,2,3 }
  };
  int l1 = placeOfClosest(numbers,0,0);     // 0;
  int l2 = placeOfClosest(numbers,10,10);   // 3;
  int l3 = placeOfClosest(numbers,2.1,2.1); // 1;
4.
Now combine all previous knowledge so that you can add the following clauses in the main program of task 2:
        double xk = average(dots[0]); // Center of mass
        double yk = average(dots[1]);

        int i = placeOfClosest(dots,xk,yk); // The place of 2D-mide

        window.add(new Circle(xk,yk,r*1.4)).setColor(Color.RED);
        window.add(new Circle(dots[0][i],dots[1][i],r*1.2))
              .setColor(Color.GREEN);

        double xm = mide(dots[0]); // Mide of each component
        double ym = mide(dots[1]);
        window.add(new Circle(xm,ym,r2)).setColor(Color.CYAN);
5.
Draw a picture of three dimensional array into a text file with help of the
picture in ohj2 handout. Continue by drawing an another picture of two dimensional string array using the
picture of args array
given. Draw both files into a same text file. Use the
ConText editor for example.
6.
Matrices: Write a function subprogram that sums up two matrices entrywise. For example:
    public static void main(String[] args) {
        double mat1[][] = {{1,2,3},{2,2,2},{4,2,3}};
        double mat2[][] = {{9,2,8},{1,2,5},{3,19,-3}};

        double mat3[][] = sum(mat1,mat2);
        print(mat3);
    }
would print (
print has been modified from the lecture example
Matrices.java for a
double -matrix):
10,00  4,00 11,00
 3,00  4,00  7,00
 7,00 21,00  0,00
B1.
Write a Java program in which you present and initalize a 3 dimensional real number array. Also present and initalize a 2 dimensional string array. Write two
print -subprograms to print the aforementioned arrays with.
GURU-tasks
G1-2.
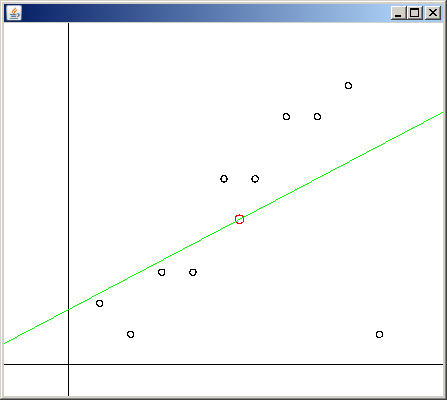
LSF: Least Squares Fitting is a way of calculating a kind of ”medium” or trend for the material. For example we have viewpoints that should basically form a ”line”. By calculating the multipliers a and b for the LSF-line (
y = a + bx) we can draw a line that best describes our material. Check out the formula for calculating the multipliers (12) and (14)
http://mathworld.wolfram.com/LeastSquaresFitting.html and write a program that draws the material and the LSF-line that describes it. The material is drawn like in task 4 meaning you can use the drawing subprogram there (or from last times guru-task). Example:
pns.png.