ENLTA/EALTA survey on language testing
and assessment, Report Part 2
Overall need for training in language testing
and assessment by region
The following charts give
an overall picture of the ‘amount’ of need for assessment education in
different regions of
Respondents were not
required to answer all questions. Consequently, some of them did not reply to
every question in the questionnaire, e.g. they marked only some of the
assessment activities or they answered the question on the current engagement
in certain activities but did not reply the associated questions on previous
education or need for further education in those activities. Thus, there is
some missing data in these survey data. Of the 855 European-based respondents
in the survey, 741 accessed the Teachers’ Questionnaire (Part/Version 1 of the
three questionnaires) but the number of responses to the individual questions
on assessment activities varied from 527 to 614.
Chart 1. ‘Average’ need for assessment training
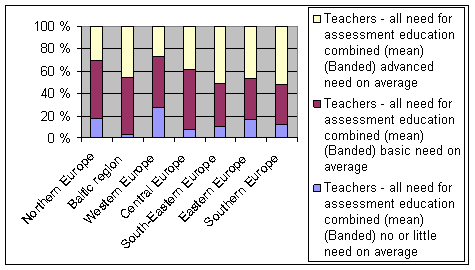
On average, the need for
education / training on assessment (no need / basic need / more advanced need)
was quite strong in the sense that 80-90% of the respondents who replied to one
or more of the 25 assessment activities reported that they need further
training in those activities (see ‘Charts & descriptions, activity by
activity’ for details). There was considerable
variation between the regions. Because the computing of an average for each
respondent from his/her responses to the questions on the need for training in
individual situations is not strictly speaking correct (the scale 1 = no need,
2 = need basic training, 3 = need advanced training is not on an interval
scale), one should not draw too firm conclusions from Chart 1, nor from the crosstabulation of the average need and regions. However,
because the trends visible in Table 1 closely correspond to the picture one
gets by looking at the results for individual assessment activities (see the
‘Charts & descriptions’), it is worth reporting
the main results here.
The respondents from
different regions differed significantly from each other in terms of their
average / overall need for assessment training. In particular, the Western
European respondents differed from the rest when it comes to the number of
those who either needed no further training at all (more such respondents) or
those who needed advanced training (fewer such respondents). Fewer Baltic
respondents than could be expected reported no need for training,
and the same trend could be observed for both the Central and South-Eastern
European respondents. South-Eastern Europeans reported need for advanced
education more often than the others, whereas the Northern Europeans did that
less often.
Chart 2. Number of activities where need for basic education
was expressed
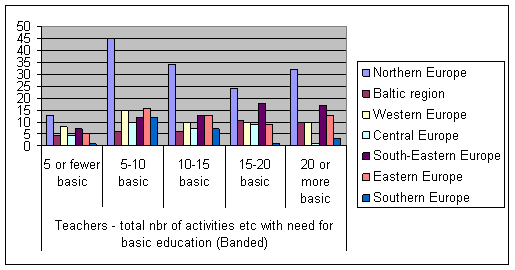
There were no statistically
significant differences between the regions in terms of how many different
assessment situations they selected as targets of basic education. The need for
basic training seems to spread quite evenly as far as the number of situation
where such need was felt is concerned. Only the ‘5 or fewer’ category attracted
somewhat fewer responses: that is, of those respondents who needed basic
training in at least some situations, only a few needed it only in a couple of
situations only – usually, they needed it in several or many situations.
Chart 3. Number of activities where need for advanced
education was expressed
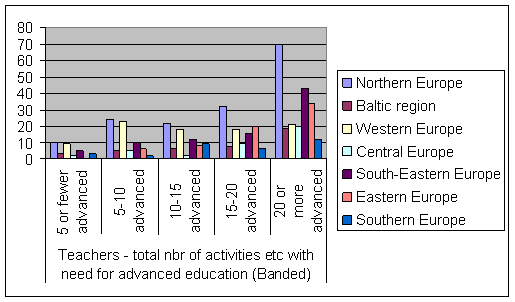
Statistically significant differences were found between the regions in terms
of how many different assessment situations they selected as targets of more
advanced education (chi square = 40.7, df = 40, p =
.018). Compared with the previous chart on the extent of need for basic
education, this chart clearly shows that when the respondents felt a need for
more advanced training, they needed it in quite a few different assessment
situations / tasks. The Western Europeans, again, differed from the others in
that fewer than could be expected reported a need for advanced training in 20
or more different situations. Compared with the others, then, when the Western
Europeans reported a need for advanced training, the need tended to focus on
fewer activities than was the case for respondents from the other regions. In
contrast, there were fewer Eastern European respondents who were in need of
advanced training in only 10 or fewer activities, i.e. those Eastern Europeans
who needed advanced training, needed it more different activities than the
other respondents.